
Vibration on pump P-101 crossed the alert threshold on September 24, 2026 and the bearing was replaced during a planned stop on October 21. In 2026 the diesel tank fell to a low of 18.8% and always stayed above the operating minimum of 10%, although two of 53 deliveries did not match the truck's delivery note and on two Sundays the level dropped with no consumption to explain it.
The system
The plant has a boiler that runs Monday to Saturday, from 6 am to 10 pm, and burns about 1,500 litres of diesel a day. An emergency generator draws fuel from the same tank, a horizontal cylinder of 31,416 litres that is 2.5 m in diameter and 6.4 m long. A 2.2 kW pump, P-101, completes the installation, and diesel trucks arrive every two weeks.
A single PoligIoT module in the boiler room measures the level and temperature of the diesel in the tank, the boiler's consumption and totaliser and the pump's vibration, bearing temperature and current. The same module also watches carbon monoxide in the room, the bund leak sensor and the generator tests.
In a horizontal cylinder litres are not proportional to level, and diesel also expands with temperature. Turning level into real litres takes a formula, and the platform calculates it continuously1.
1. Pump vibration rose almost a month before the bearing was replaced
From September 2026 the pump's vibration rose little by little. It crossed the alert threshold of 1.8 mm/s on September 24 and the danger threshold of 4.5 mm/s on October 19. On October 21 the bearing was replaced and vibration fell to about 0.9 mm/s (Figure 1).
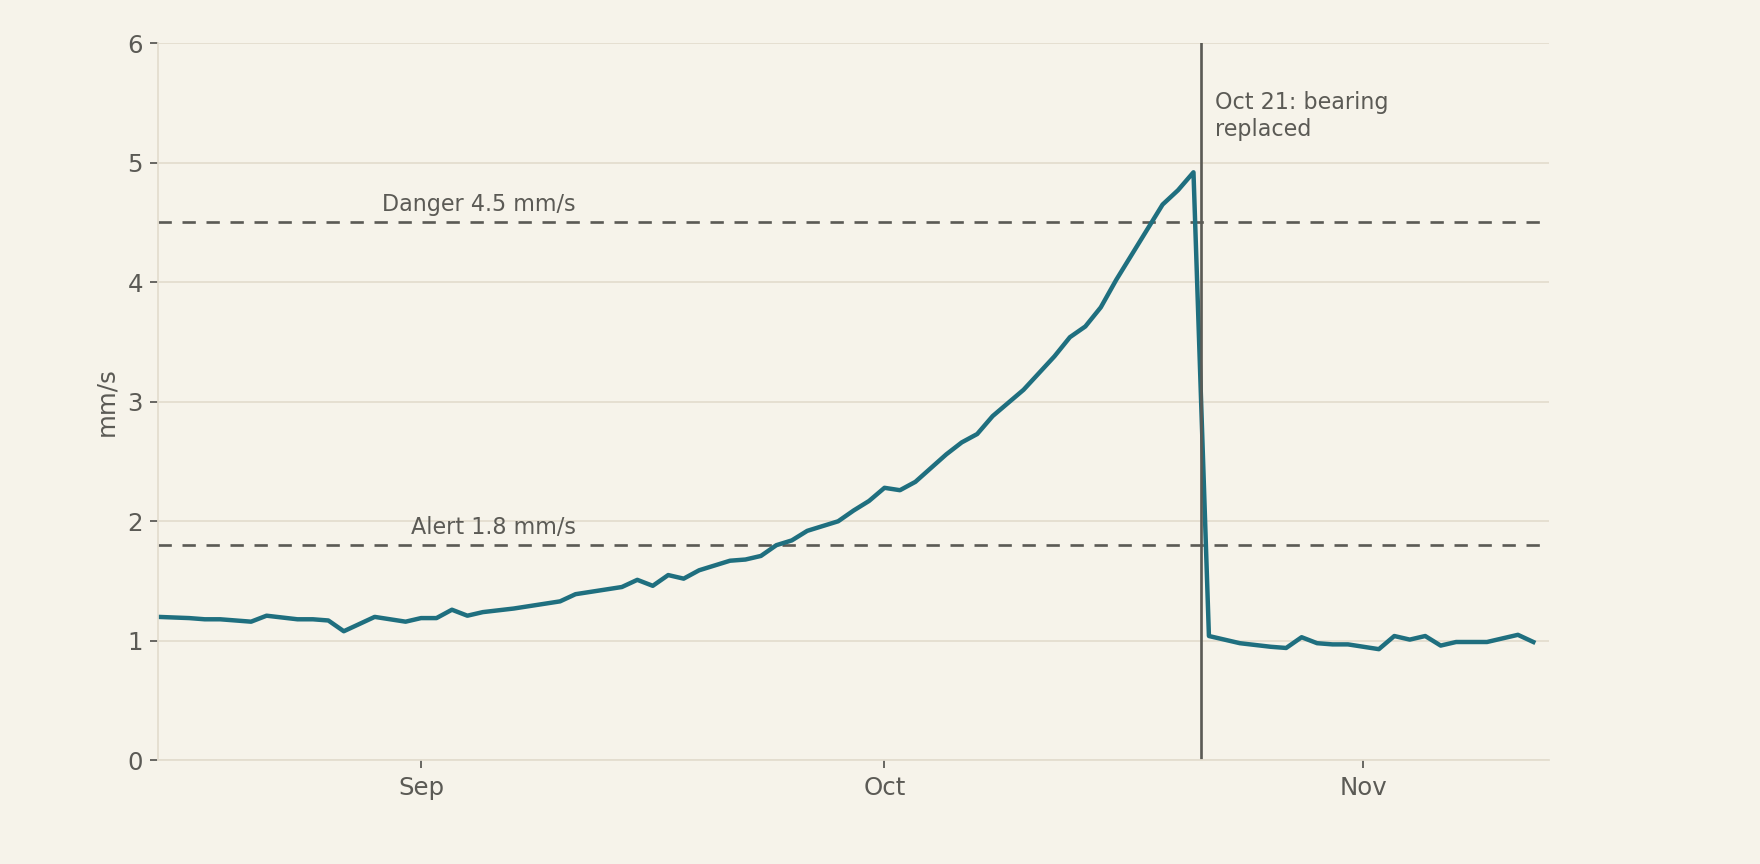
Figure 1. Pump vibration rose almost a month before the bearing was replaced. Maximum vibration of pump P-101 on each working day, in mm/s (ISO 10816). Each point is the highest vibration in a working day of the pump. It climbs for almost a month, crosses the alert and danger lines and comes back down with the new bearing.
Live data on the system dashboard: poligiot.com/d/c
That is the basis of predictive pump maintenance. With the warning on September 24 the stop could be planned, and it ran from 10 am to 3 pm on October 21, with the pump out of service for only five hours. Bearing temperature rises in parallel, from 49 °C in early September to 69 °C on October 19, and it is a second signal that confirms the diagnosis.
2. The tank fell to a low of 19% and autonomy shows in days
Converted into litres, the level draws a sawtooth that falls with daily consumption and rises with each delivery. In 2026 the tank fell to a low of 18.8%, which is 5,922 litres, on October 5, just before a delivery, and always stayed above the operating minimum of 10% (Figure 2).
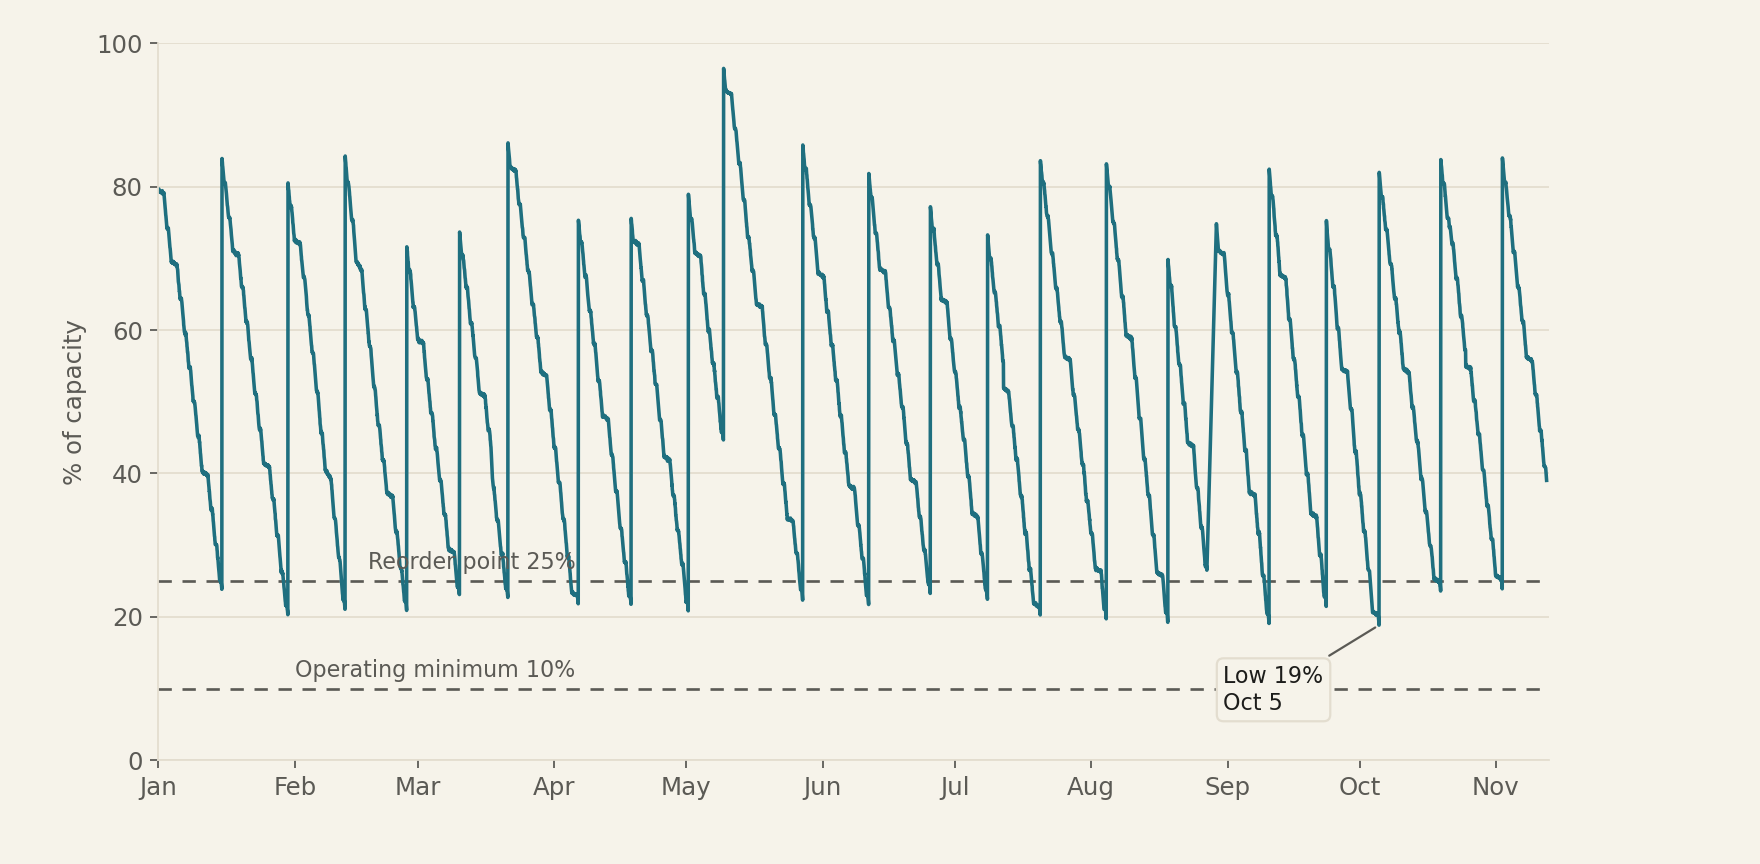
Figure 2. The tank fell to a low of 19%, above the operating minimum. Diesel stock in the tank in 2026, as % of the 31,416 L capacity (one delivery every two weeks). The line is the diesel left in the tank, as a percentage of its capacity. Almost every cycle goes below the 25% reorder point, and none reaches the 10% operating minimum.
Live data on the system dashboard: poligiot.com/d/c
The platform also calculates autonomy in days, which is the stock divided by the boiler's average daily consumption, and which today is around 9 days.
3. Two deliveries and two Sundays do not add up
Because the level is stored every hour, things that used to stay out of sight can now be reviewed. Of the 53 recorded deliveries, two did not match the truck's delivery note2. On May 1, 2026 20,000 litres were declared and the tank received about 18,350, and on May 9 another 20,000 were declared and about 16,378 went in, because the tank filled up before the unloading was finished.
There were also two Sundays when, with the boiler stopped, the level fell with no consumption to explain it, about 1,180 litres on July 12 and about 640 litres on October 25. These are signals worth investigating. Between February 17 and 19, 2026 the bund sensor detected liquid, and on February 19 a dripping valve was repaired.
The record also reveals faults in the system itself. On June 2, for three hours, the level sensor read 2.5 m, the top of its scale, with the tank at 61%. It was a sensor fault, which is why the platform discards those readings when calculating stock and why they do not appear in the chart either. From 8 am on August 27 to 10 am on August 29 the module went 51 hours without sending data, and a delivery of 19,000 litres came in during that gap, which the jump in level made it possible to identify as soon as communication returned.
On safety, carbon monoxide in the boiler room peaked above the alert threshold of 25 ppm from August 4 and above the danger threshold of 50 ppm from August 7, almost always when the boiler started. The last peak was on October 2, and on October 6 the burner was cleaned and adjusted.
What the platform does with this
In diesel tank monitoring, the calculated indicators are diesel stock, in litres at 15 °C and as a percentage, and autonomy in days. The alerts warn when stock falls below the reorder point as a warning and below the operating minimum as a critical situation, when autonomy is under three days, when pump vibration enters alert or danger, when the same happens with carbon monoxide and when there is a leak in the bund. All of this comes together in a dashboard with the tank, the boiler, the pump and safety.
The same data can be followed in real time on the system dashboard (Figure 3).
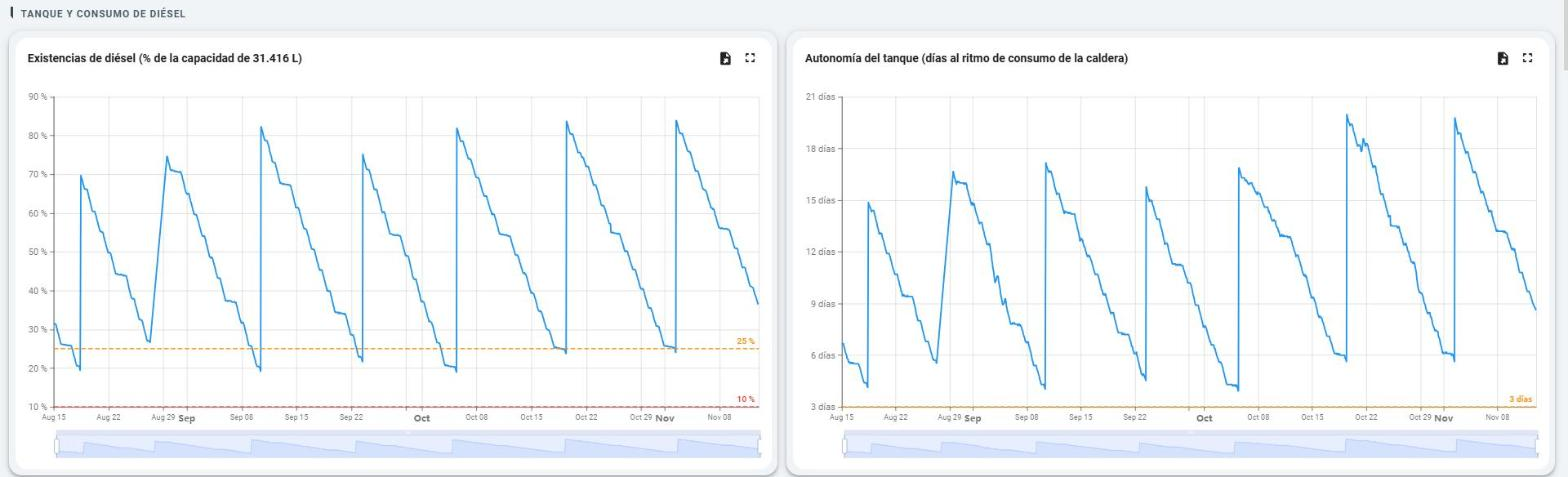
Figure 3. The dashboard tracks diesel stock and tank autonomy in days. Live dashboard view between August and November 2026. Each vertical rise is a delivery, and the dashed lines mark the reorder point, the operating minimum and three days of autonomy. The dashboard is in Spanish.
Live data on the system dashboard: poligiot.com/d/c
Limits and next steps
Vibration is measured at a single point on the pump and gives an overall value, which warns of wear but does not by itself say which part is failing. In this case the bearing temperature confirmed the diagnosis. The two Sunday level drops still have no confirmed cause, because the system measures how far the tank fell and not where the diesel went. Deliveries are checked against the rise in level, which has a margin of a few tens of litres.
The next step is to review the two deliveries that did not match with the supplier and to cross check the coming Sundays with the plant's security rounds. If you have a tank, a boiler or a critical pump and want to follow them in the same way, at PoligIoT we can work out with you what to measure.
Frequently asked questions
Why measure pump vibration? Because bearing wear raises vibration weeks before a breakdown. With an alert threshold, the replacement is done during a planned stop.
How are litres calculated in a horizontal tank? With the geometry of the cylinder, which turns level into volume, and with a temperature correction that brings the volume to 15 °C. The platform does this with every reading.
Can a diesel delivery be verified? Yes. The rise in level, converted into litres at 15 °C, is compared with the litres on the truck's delivery note, with a tolerance of a few tens of litres for measurement noise.
How does monitoring prevent running out of diesel? It turns level into litres and days of autonomy and warns when stock falls below the 25% reorder point or when fewer than three days remain. In 2026 the tank never fell below the 10% operating minimum.
Are the data in this case real? The data analysed in this article correspond to situations emulated from typical behaviour scenarios for the area. Any resemblance to reality is purely coincidental, so these data must not be used for any technical assessment or conclusion.
Notes and related reading
1. Volume comes from the geometry of the horizontal cylinder, 2.5 m in diameter and 6.4 m long, and is corrected to 15 °C with a diesel expansion coefficient of 0.00083 per degree.
2. Each delivery is compared with the rise in level converted into litres at 15 °C. Differences of a few tens of litres are due to measurement noise and are not counted.
Other case studies in this series are Continuous monitoring showed a coastal well yielding 16% less as salinity reached the threshold and An orange farm exceeded its annual water permit on October 17 and pumped almost 17,000 m³ it did not need. The data in this article can be followed in real time on the system dashboard.
Written by Mario García Torres, PhD
Strategic Technology Director of Research and Development