In January and March 2026 the production well pumped 12,748 and 12,663 m³, above the permit of 12,000 m³ per month. In a hydrological year with 42% less rain, salinity rose in all eight monitoring wells until PM-04 reached the threshold of 1.0 kg/m³, while the specific capacity of the well fell by 16% over two and a half years, still well short of the 25% drop at which rehabilitation is advisable.
The system
The water system serves 620 connections and about 2,200 people on a coast with a dry season from December to April, which coincides with the peak tourist season. It draws from an unconfined coastal aquifer about 50 metres thick.
The water comes from a single production well, P-1, which is 62 metres deep and lies 1,400 metres from the coast, with a permit of 6.0 L/s and 12,000 m³ per month. The probe that PoligIoT installed in the well measures flow, level, pressure and energy every hour. Around it there are eight monitoring wells, PM-01 to PM-08, laid out in two lines that run inland from the coast, one to the north and one to the south, and they measure water level and salt concentration every six hours. A weather station completes this groundwater well monitoring setup.
The salinity threshold used in this system is 1.0 kg/m³. Since the wells closest to the sea are always above it, what matters is knowing at which point along each line the threshold is crossed.
1. The 2026 peak season exceeded the permit
Monthly pumped volume ranges between 8,800 and 11,600 m³, but in January 2026 it reached 12,748 m³ and in March 12,663 m³, above the permit of 12,000 m³ per month. Both months belong to the same peak season, the one with the most tourism and the most heat, while the 2025 peak season stayed below the limit (Figure 1).
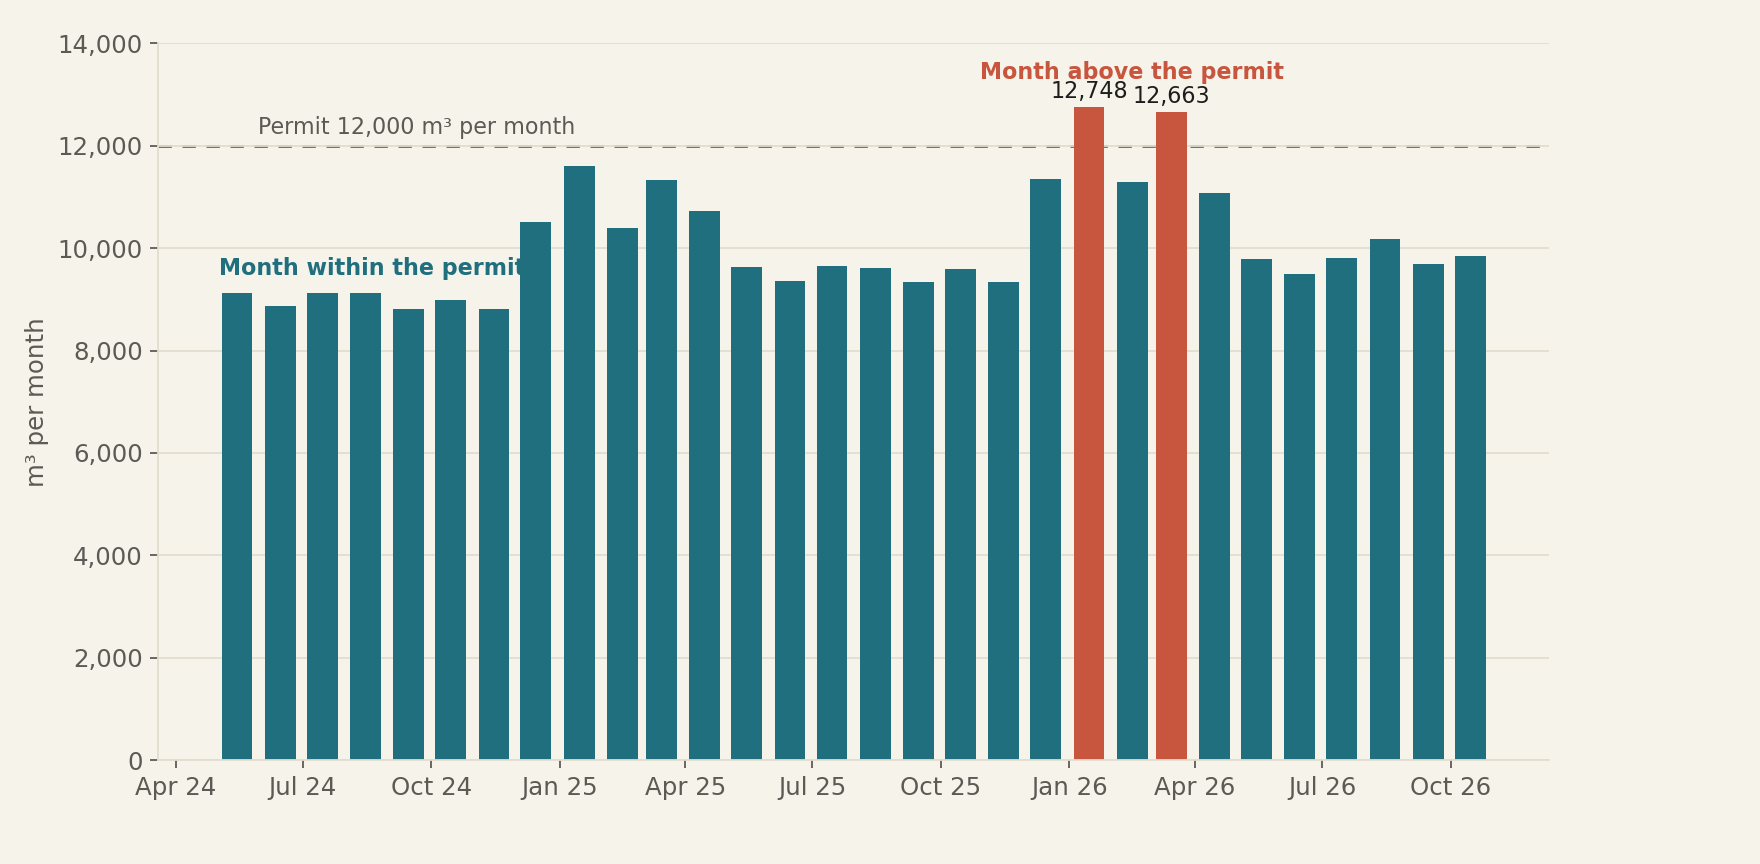
Figure 1. Two peak-season months in 2026 exceeded the monthly water permit. Volume pumped each month by production well P-1, in m³ (permit: 12,000 m³ per month). Each bar is the water that left the well in one month. The two orange bars, January and March 2026, went beyond what the permit allows.
Live data on the system dashboard: poligiot.com/d/a
The excess also shows up hour by hour, because between January 12 and April 20, 2026 the pump ran at 6.9 L/s and the flow at P-1 stayed above the permitted 6.0 L/s for 1,579 hours. With continuous monitoring the committee sees this within the same month, while it can still adjust pumping.
2. Salinity reached the threshold at PM-04 after a dry year
From one hydrological year to the next, rainfall went from 1,932 mm to 1,118 mm, 42% less. With less recharge, salinity rose in all eight monitoring wells, and PM-04, the first well along the line that is normally below the threshold, reached 1.001 kg/m³ on May 22, 2026 (Figure 2).
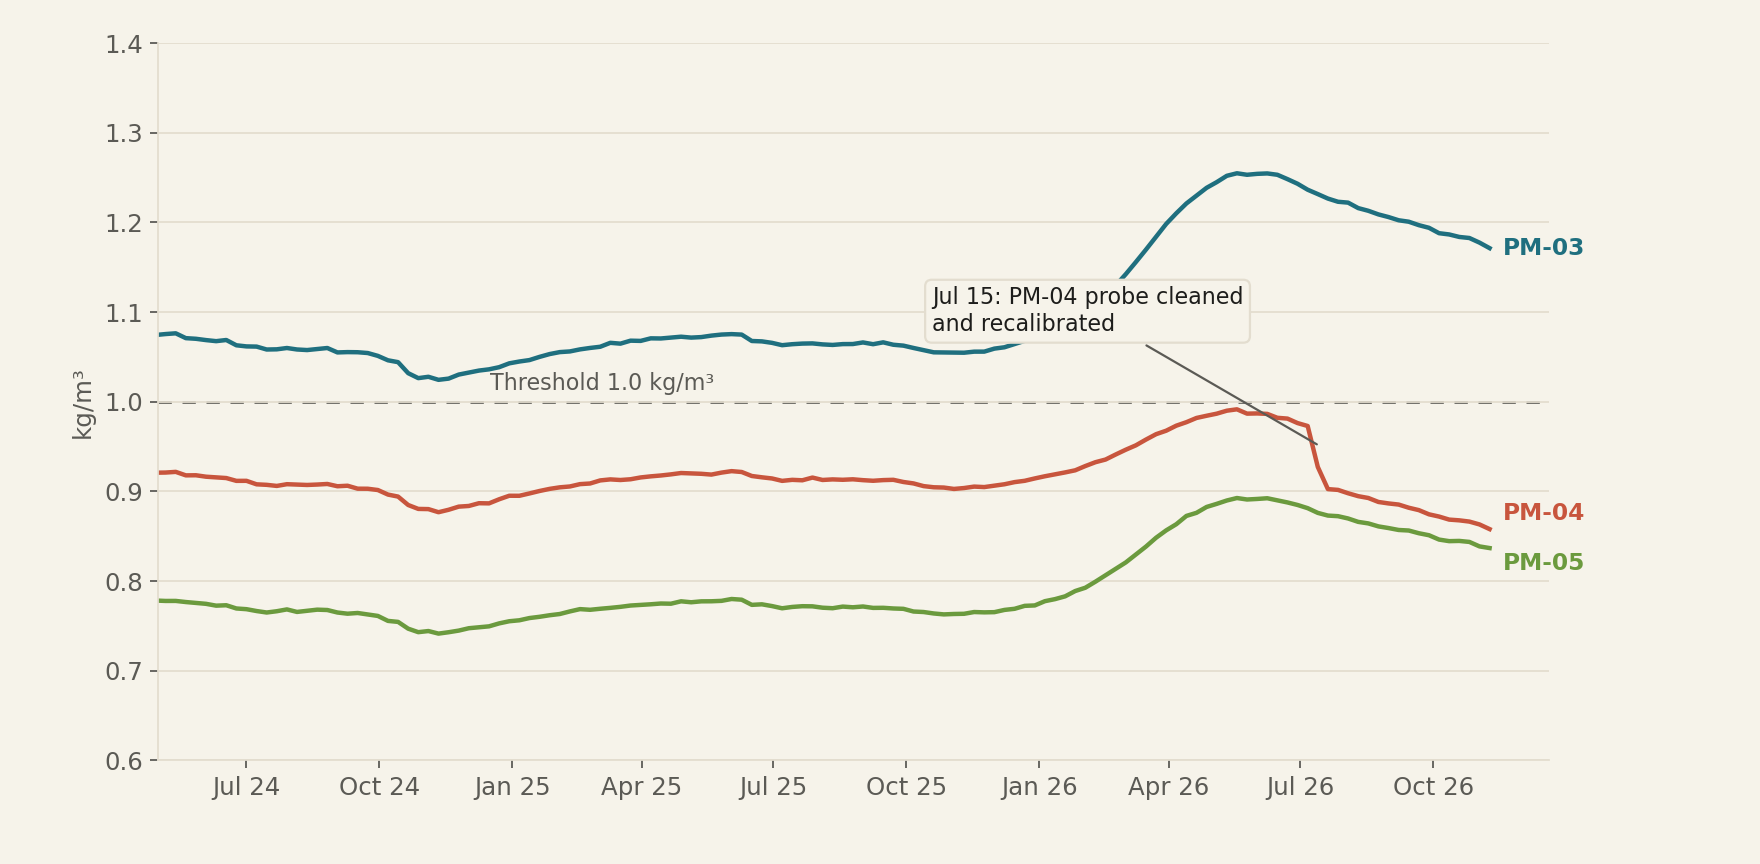
Figure 2. Salinity rose in 2026 until PM-04 reached the threshold. Salts in three monitoring wells, weekly mean, in kg/m³ (threshold: 1.0 kg/m³). Each line is the weekly salinity of a monitoring well, and the higher it sits, the closer seawater is. Salinity rises in 2026, and the sharp drop at PM-04 in July corresponds to the cleaning and recalibration of its probe.
Live data on the system dashboard: poligiot.com/d/a
Here continuous monitoring provides the context for each reading. The drop at PM-04 in July coincides with the probe maintenance on July 15, and because the system record on the platform logs that maintenance, nobody mistakes it for an improvement in the aquifer2.
3. The well yields 16% less per metre of drawdown
Specific capacity tells you how many litres per second the well delivers for each metre the water level drops while pumping, and when it falls the well is clogging or the aquifer is being depleted. Calculated from the level and flow the probe already measures, and only with the pump at steady rate, the specific capacity of P-1 fell by 16% over two and a half years, from 2.09 to 1.75 L/s per metre1 (Figure 3).
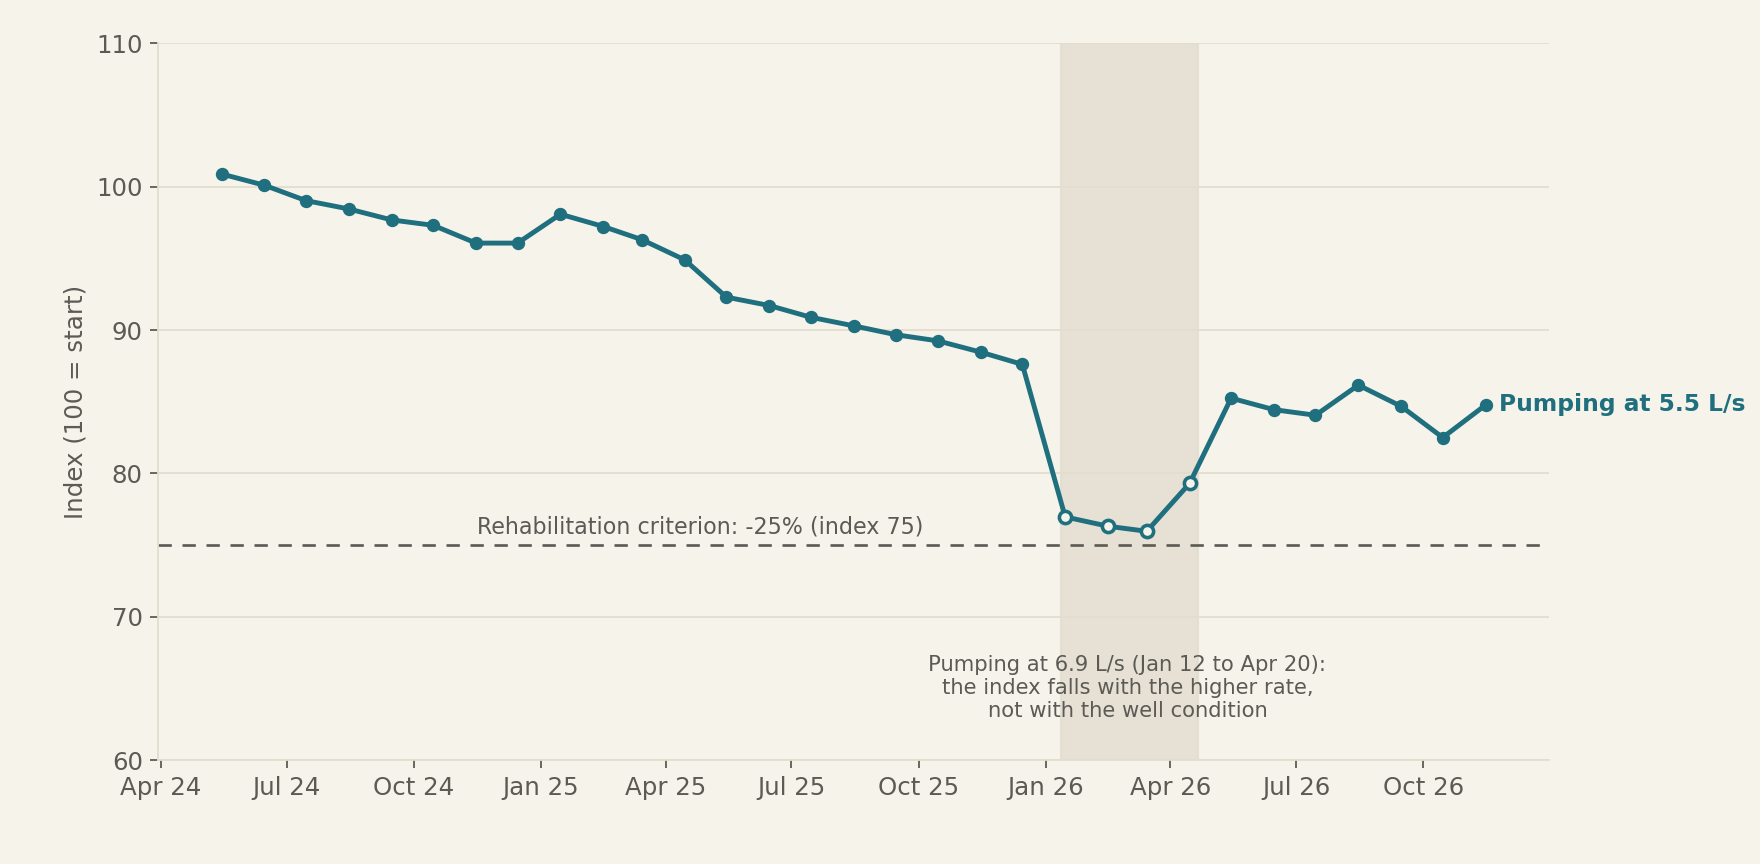
Figure 3. The production well yields 16% less per metre of drawdown. Specific capacity of P-1 at steady pumping, monthly mean, as an index (100 = mean of the first three months). Index 100 is the well's performance in its first three months, and the dashed line marks the 25% drop beyond which rehabilitation is advisable. Hollow points are the months of pumping at 6.9 L/s, which are read separately.
Live data on the system dashboard: poligiot.com/d/a
The low point in February and March 2026 has its own explanation. In those months the pump ran at 6.9 L/s instead of the usual 5.5, and a well always yields less per metre when it is asked for more flow, because losses inside the well grow faster than the flow itself. That is why the index rises again in May, when the pump goes back to 5.5 L/s, and why the valid comparison is at equal flow. Between the first three months and the last three, all at 5.5 L/s, the loss is 16%.
The well is still nine points away from the rehabilitation criterion, which is a 25% drop, and the trend leaves room to plan the cleaning without haste.
4. The system also watches its own probes
Good monitoring also detects when a sensor fails, and the record includes two episodes. From March 8 to 10, 2026 the level probe at P-1 read 43.0 m for 53 readings in a row. Since 43 metres is the depth at which the sensor is installed, this was a reading stuck by a fault rather than the water level, so the stuck reading alert set it apart from the rest until the transducer was replaced on March 10.
In September 2026 it was the battery of the PM-06 probe that dropped below 3.1 V on the 11th and below 3.0 V on the 18th, the limit beyond which transmission is no longer guaranteed. The last battery reading, 2.95 V, arrived on the 20th, the probe sent salinity until early on the 21st and the well had no data until the 25th, when the battery was replaced. The low battery alert, set at 3.1 V, gives ten days of margin to schedule the visit.
What the platform does with this
Raw data reach the platform and are turned into indicators and alerts, so nobody has to check curves every day. The calculated indicators are the number of monitoring wells above the salinity threshold, which shows how far the saline front reaches, and the specific capacity of P-1. The alerts warn before PM-04 crosses the salinity threshold, when flow exceeds the permit for three hours in a row, when the P-1 probe gets stuck on a reading and when the battery of the monitoring well probes runs low. All of this comes together in a dashboard with the wells, salinity, levels and volume, designed for the committee or the operator.
The same data can be followed in real time on the system dashboard (Figure 4).
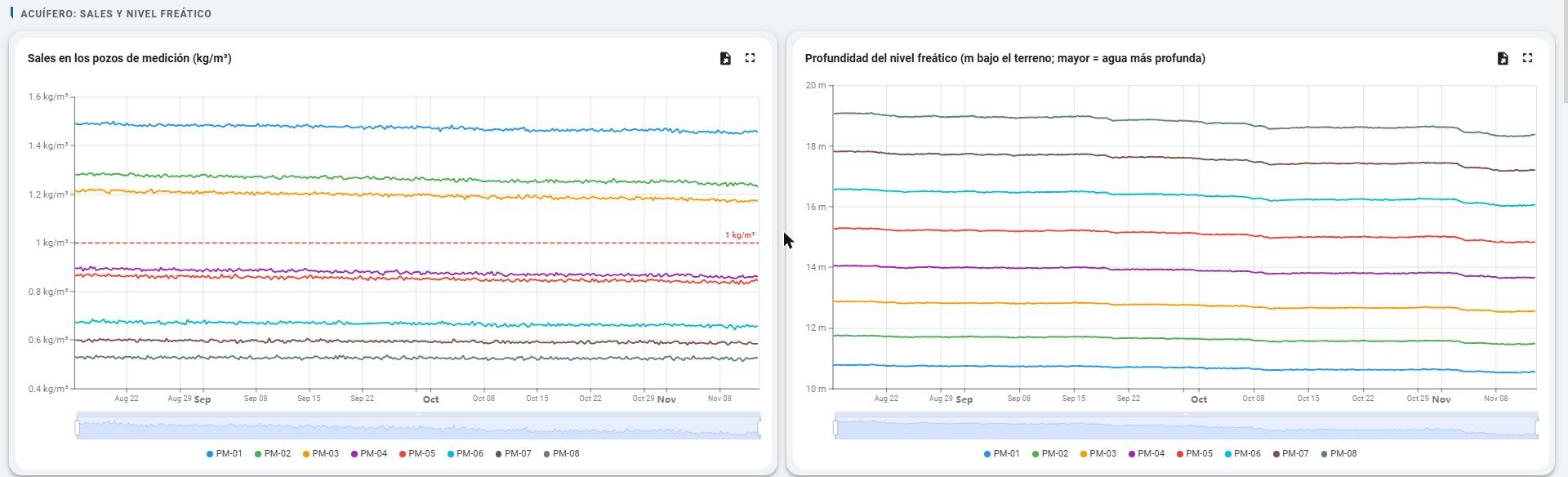
Figure 4. The dashboard brings together salinity and level in the eight monitoring wells. Live dashboard view between August and November 2026, with one line per well. The red dashed line marks the salinity threshold. The dashboard is in Spanish.
Live data on the system dashboard: poligiot.com/d/a
Limits and next steps
Specific capacity is an estimate, because the static level of the well is only known when the pump stops for at least five hours in a row, and in the months of highest demand that stop does not always happen. Salinity is measured at eight points along two lines, so the position of the saline front between one line and the other is inferred rather than measured. We do not yet know how the aquifer will respond to the next rainy season, which will show whether PM-04 drops back below the threshold or whether the saline front stays where it is.
The next step is to follow the 2027 peak season with the permit in view from the first day and to check whether better distributed pumping keeps salinity at PM-04 below 1.0 kg/m³. If you manage a water system and want to run the same follow-up on your own wells, at PoligIoT we can work out with you what to measure and where.
Frequently asked questions
What is specific capacity and why does it matter? It is the flow a well delivers for each metre its level drops while pumping. If it falls over time, the well is clogging or the aquifer is yielding less, and that is the signal to schedule a cleaning before water runs short.
How do you tell a real change in the aquifer from a probe problem? With the maintenance log in the system record and with alerts that recognise impossible readings, such as a fixed level equal to the sensor depth. That is why the drop at PM-04 in July is read as a recalibration and the 43 m reading as a fault.
What do monitoring wells measure, and how often? In this system the eight monitoring wells record water level and salinity every six hours, and the production well measures flow, level, pressure and energy every hour. Together they show how far the saline front reaches and how the aquifer responds to pumping.
What instrument measures the water level in the well? A pressure transducer installed inside the well, which at P-1 sits 43 metres deep and sends a reading every hour. That is why a reading stuck at 43.0 m points to a sensor fault and not to the water level.
Are the data in this case real? The data analysed in this article correspond to situations emulated from typical behaviour scenarios for the area. Any resemblance to reality is purely coincidental, so these data must not be used for any technical assessment or conclusion.
Notes and related reading
1. Specific capacity is only calculated with the pump at steady rate, at 5 L/s or more in that hour and the six before it, and only when the pump was stopped for at least five hours in a row during the previous 48 hours, because without that stop there is no reliable static level. The values of 2.09 and 1.75 are the means of the first three months and of the last three.
2. On July 15, 2026 the salinity probe at PM-04 was cleaned and recalibrated, and its reading fell by 0.06 kg/m³. The system record keeps that maintenance with its date.
Other case studies in this series are An orange farm exceeded its annual water permit on October 17 and pumped almost 17,000 m³ it did not need and Pump vibration gave a 27 day warning before the bearing was replaced. The data in this article can be followed in real time on the system dashboard.
Written by Mario García Torres, PhD
Strategic Technology Director of Research and Development