In 2026 the farm reached the 240,000 m³ of its annual water permit on October 17 and closed the period at 104%, compared with 89% in 2025. During the September heat wave sector 3, with sandy soil and a shortened irrigation shift, spent eight days below the irrigation threshold while sectors 1 and 2 stayed above it, and over the period a wrong schedule in sector 2 and three nights of irrigation after rain added up to almost 17,000 m³ pumped with no need.
The system
The farm is a 36 hectare orange grove in Brazil, divided into three sectors of 12 hectares under drip irrigation. Water comes from a 36,000 m³ reservoir and goes through a 30 kW pumping head with filters. The water permit, which in Brazil is called outorga, allows at most 160 m³/h and 240,000 m³ per year, and irrigation starts at 9:30 pm, in the cheapest energy period.
The irrigation monitoring system installed by PoligIoT brings together three soil moisture sensors, one per sector at 20, 40 and 60 cm depth, along with flow and pressures at the pumping head, the reservoir level and a weather station.
The sectors have different soils, because S1 and S2 are clay loams that hold more water, while S3 is a sandy loam that holds less. That is why raw moisture percentages are misleading when comparing them, and what is compared instead is available water, that is, how much of the water the soil can store for the plant is still there1.
1. The annual permit was exceeded on October 17
In 2025 the farm used 214,638 m³, 89% of the permit. In 2026 the cumulative volume reached 240,000 m³ on October 17 and closed the period at 250,583 m³, 104% of the permit (Figure 1).
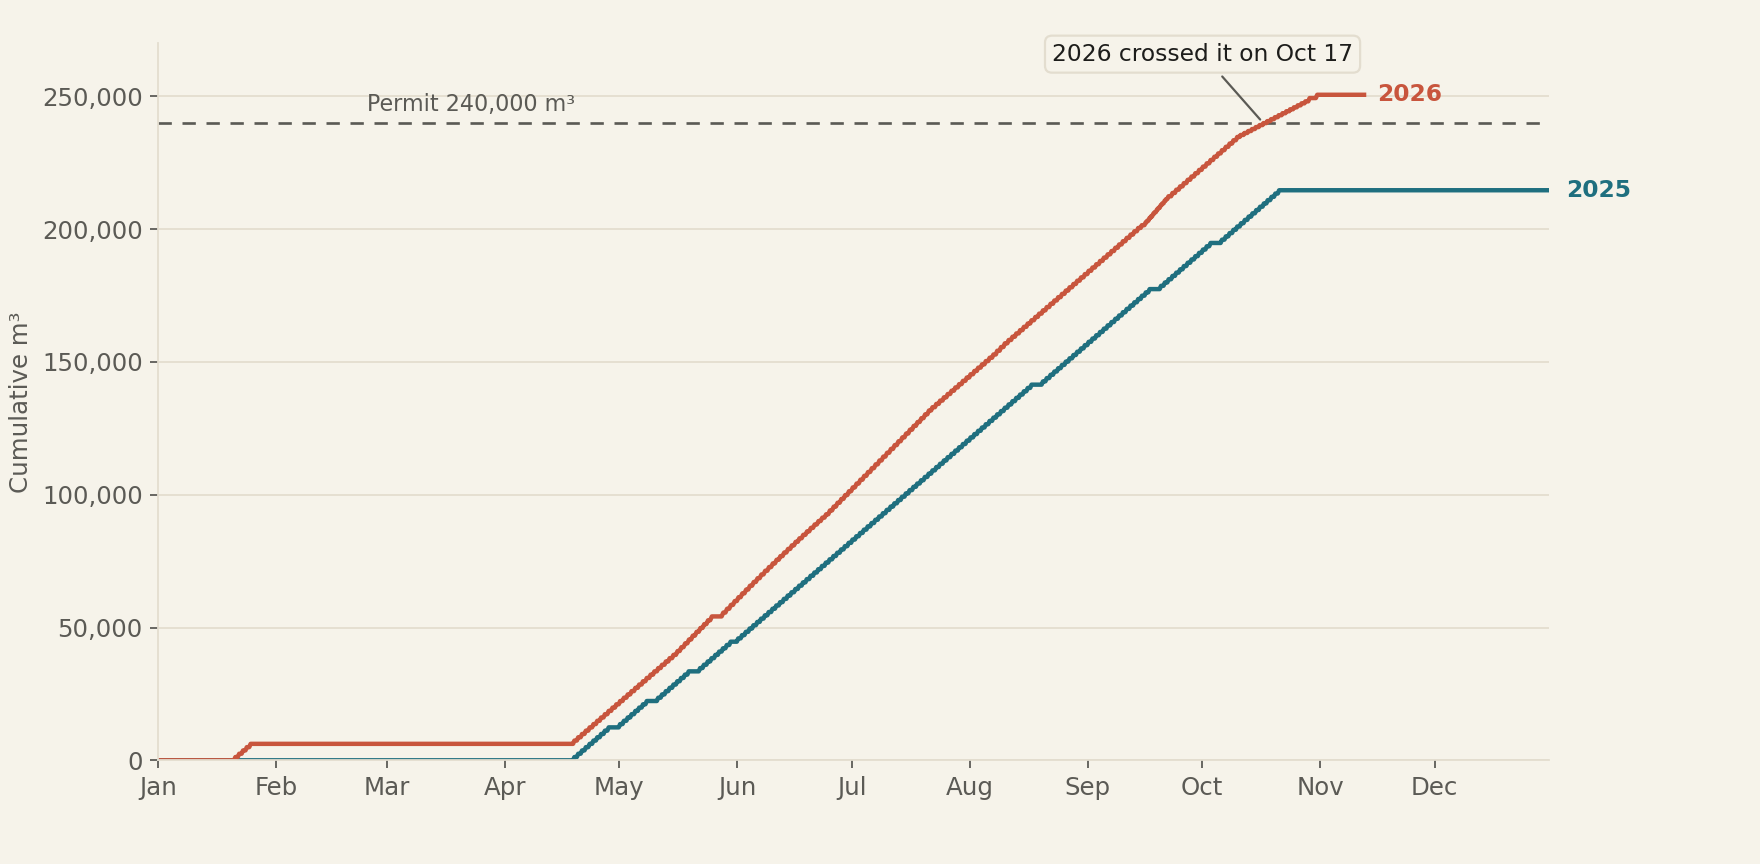
Figure 1. In 2026 the annual water permit was exceeded in October. Cumulative volume pumped since January 1, in m³ (permit: 240,000 m³ per year, with 89% used in 2025). Each line adds up the water pumped since January 1. The orange one, for 2026, crosses the annual permit on October 17.
Live data on the system dashboard: poligiot.com/d/b
With cumulative volume in view all year, the conversation about the pace of the season happens in August, when it can still be adjusted, and not at the following year's review.
2. Sector 3 spent eight days below the threshold during the heat wave
Between September 14 and 21 a heat wave pushed the temperature to 39.9 °C. To save water in the reservoir, the night shift for sector 3 was cut from 2.8 to 1.5 hours on those days, and sectors 1 and 2 received a daytime top up irrigation from the 16th. Sectors 1 and 2 stayed above the threshold, but sector 3, with sandy soil and less water applied, fell to 35% available water and spent eight days, from September 18 to 25, below the irrigation threshold, which sits at about 57% (Figure 2).
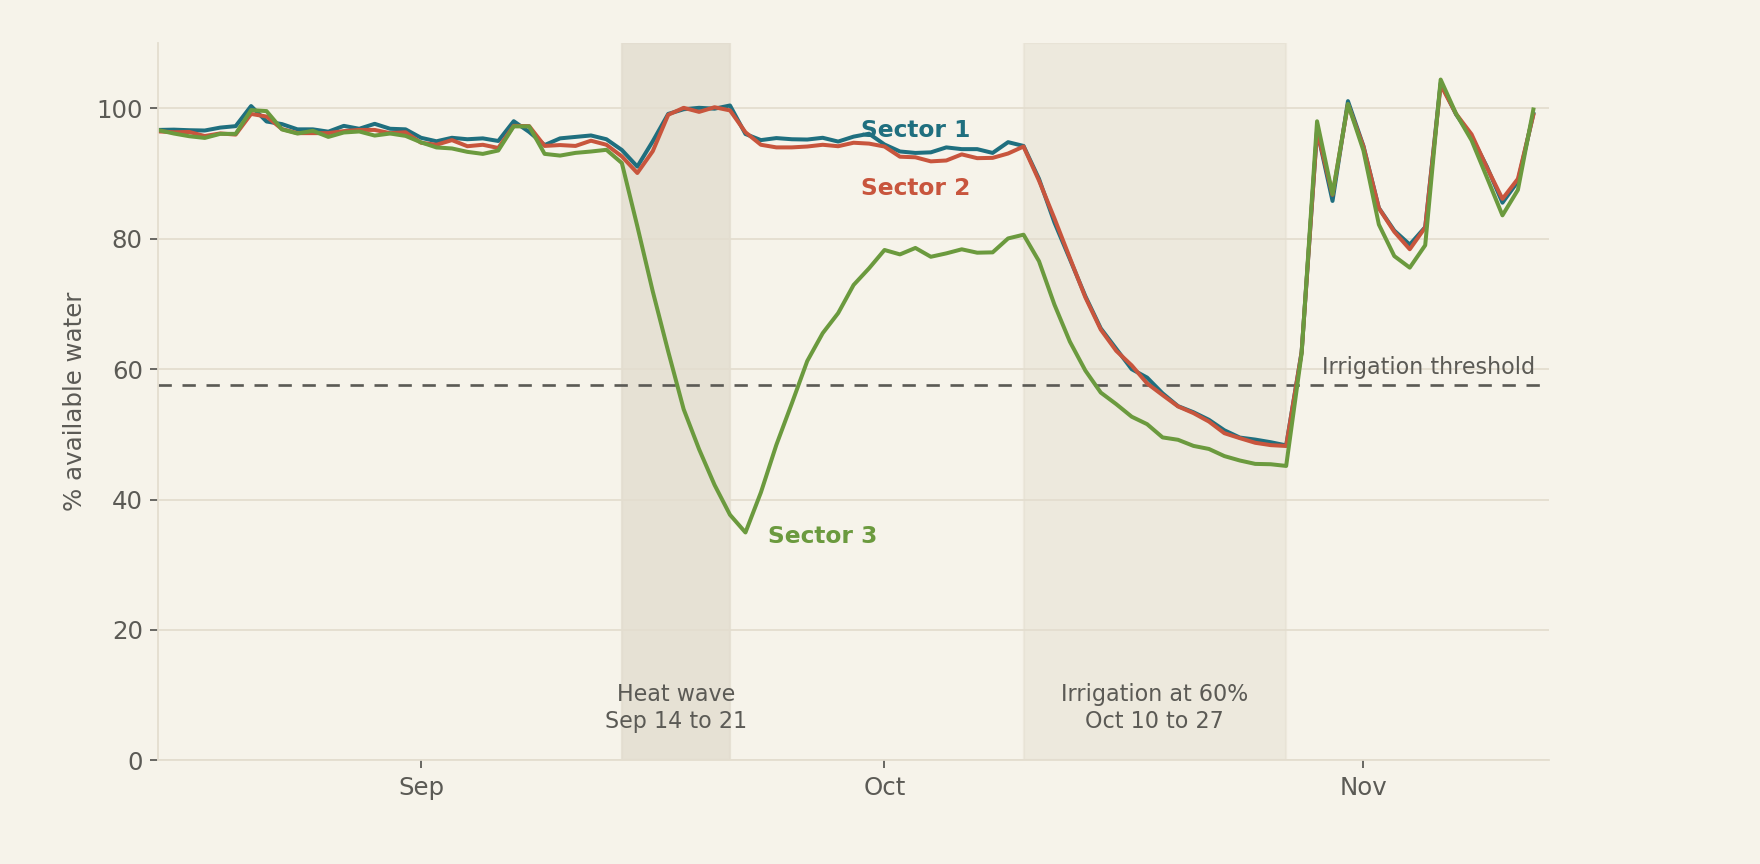
Figure 2. Sector 3 spent eight days below the threshold in the heat wave. Plant-available soil water by sector, daily mean, in % (irrigation threshold: about 57%). Each line shows how much of the soil's useful water is still available to the plant in each sector. Sector 3 drops during the heat wave, and in October all of them fall because irrigation was cut to 60%.
Live data on the system dashboard: poligiot.com/d/b
In raw moisture percentage sector 3 always looked "dry" and sectors 1 and 2 always looked "wet", because the soils are different. Measured as available water, the comparison is fair and shows the cost of a management decision, which was to cut the shift of the sector that holds the least water in the hottest week of all.
The second part of the chart records another episode. From October 10 to 27 irrigation was cut to 60% because the reservoir was at its limit, with a minimum of 0.94 m in 2026 against 2.32 m in 2025.
3. Almost 17,000 m³ pumped with no need
Continuous tracking brings two kinds of wasted water into view. The first is irrigation after rain, which happened on three nights, October 19 and 20, 2025 and October 28, 2026, when irrigation ran as usual after heavy rain and applied about 1,241 m³ per night, 3,723 m³ in total. In October 2025 moisture at 60 cm went above field capacity, a sign of water lost below the roots. In 2026 the soil was dry from the reduced irrigation and moisture at 60 cm stayed below field capacity, but the farm's rule, which is not to irrigate after more than 10 mm of rain in 24 hours, was broken all the same.
The second is a wrong schedule in sector 2, which from May 15 to July 20, 2026 was set to 4.2 hours instead of 2.8 over 65 irrigation nights. That came to about 13,100 m³ too much, with percolation at 60 cm and with irrigation running into the most expensive energy period.
4. The system detects breaks and faults
On the nights of August 7 to 9, 2026 flow reached 205 m³/h, above the 160 m³/h of the permit, with outlet pressure at 2.3 bar. It was a pipe break that lost about 480 m³ over a weekend, until the repair on the 10th.
Earlier, between July 3 and 6, the 40 cm probe in sector 1 had read 0.0%. That is an invalid reading which the platform discards when calculating available water, and the probe was replaced on the 6th. In June it was the filters that gave the signal, because between the 1st and the 23rd the pressure difference rose from 0.3 to 1.1 bar and flow fell from 148 to 129 m³/h, almost 13% less, until they were washed on the 24th.
What the platform does with this
The calculated indicator is the available soil water in each sector, derived from the 20 and 40 cm probes while discarding readings from a faulty probe. The alerts warn when available water in a sector falls below the irrigation threshold, when flow goes above 160 m³/h, when the reservoir drops below 1.2 m as a warning and below 0.8 m as a critical situation, when the pressure difference across the filters exceeds 0.8 bar and when a moisture probe gives an invalid reading. All of this comes together in a dashboard with soil by sector, the reservoir, flow, pressure, volume and weather.
The same data can be followed in real time on the system dashboard (Figure 3).
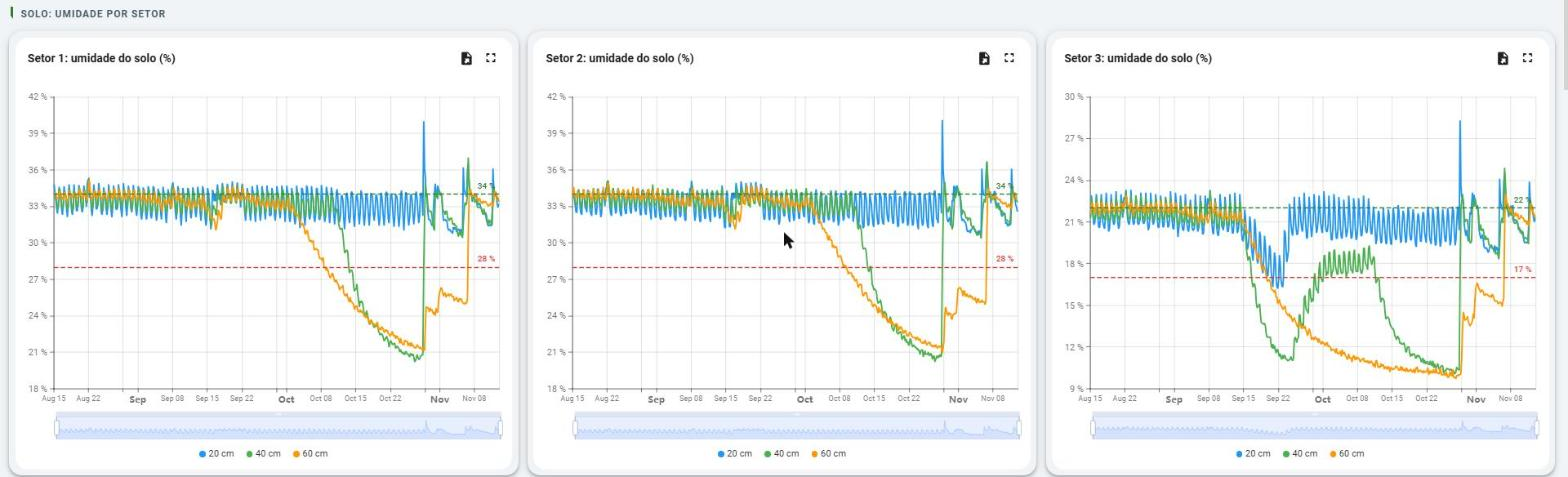
Figure 3. The dashboard shows soil moisture in each sector at three depths. Live dashboard view between August and November 2026, with one line per depth. The red dashed line marks the point below which irrigation is needed. The dashboard is in Portuguese.
Live data on the system dashboard: poligiot.com/d/b
Limits and next steps
Available water is calculated from the 20 and 40 cm probes, where almost all the roots are, and the 60 cm probe is only used as a sign of water lost below them. The 17,000 m³ of excess are an estimate that compares the programmed hours and the nights of irrigation after rain with each sector's usual shift. The effect of sector 3's eight days of stress on the harvest has not been measured, and it will only be known when its yield is compared with that of the other two sectors.
The next step is to plan the 2027 season with a monthly reference volume, so that the permit is spread over the year, and to give sector 3 its own shift during heat waves. If you grow and want to see your sectors in the same way, at PoligIoT we can work out with you which probes are needed.
Frequently asked questions
What is available soil water? It is the part of the water in the soil that the plant can use, between the wilting point and field capacity. It makes it possible to compare sectors with different soils, which raw readings from a soil moisture sensor do not.
How does the system know irrigation ran after rain? The weather station measures rainfall and the pumping head measures flow. When irrigation starts after more than 10 mm in 24 hours, the farm's rule has been broken, and the platform cross checks both readings to show those nights.
Does it help comply with the water permit? Yes. The year's cumulative volume is always in view, together with peak flow, so the irrigation pace can be adjusted before the limit is reached.
How much water does irrigation monitoring save? In 2026 water pumped with no need came to about 14,300 m³, close to 6% of the 250,583 m³ pumped that year, from the wrong program in sector 2 and one night of irrigation after rain. Adding the two nights of October 2025, the total for the period reaches almost 17,000 m³.
Are the data in this case real? The data analysed in this article correspond to situations emulated from typical behaviour scenarios for the area. Any resemblance to reality is purely coincidental, so these data must not be used for any technical assessment or conclusion.
Notes and related reading
1. Each sector's available water is the mean of the 20 and 40 cm probes expressed between the wilting point and the field capacity of its soil, and the reading of a faulty probe is discarded, such as the 0.0% reading in sector 1 in July.
Other case studies in this series are Continuous monitoring showed a coastal well yielding 16% less as salinity reached the threshold and Pump vibration gave a 27 day warning before the bearing was replaced. The data in this article can be followed in real time on the system dashboard.
Written by Mario García Torres, PhD
Strategic Technology Director of Research and Development